

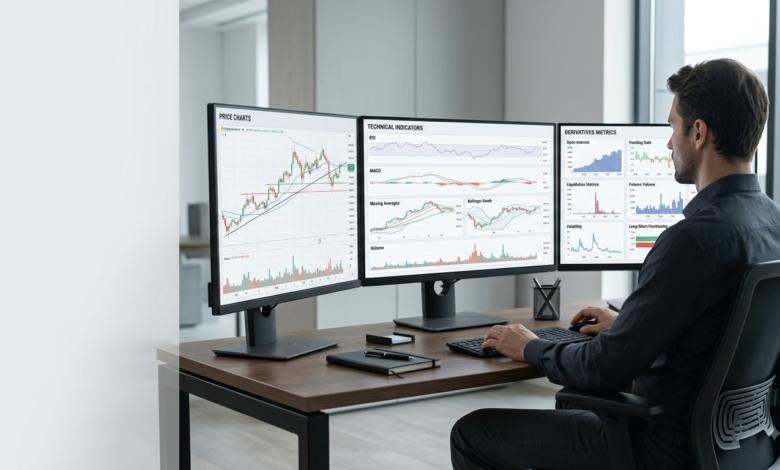
Indicator Comparison Table of Crypto Trader
| Indicator | Measures | Best Used For | Main Limitation |
| Moving Average (SMA/EMA) | Trend direction & baseline | Identifying macro trend bias and dynamic support/resistance | Lagging nature; prone to whipsaws in sideways consolidation |
| Relative Strength Index (RSI) | Price momentum velocity | Spotting momentum extremes and structural divergences | Can remain in overbought/oversold territory during strong trends |
| MACD | Momentum and trend relationship | Identifying trend direction shifts and momentum convergence | Lagging indicator; generates frequent false crossover signals in ranges |
| Bollinger Bands | Relative volatility & price bands | Spotting volatility contraction (squeezes) and potential breakouts | Touch of outer bands does not automatically indicate an immediate reversal |
| Volume | Market participation magnitude | Confirming price breakouts, trend strength, and liquidity | Exchange data fragmentation across spot, futures, and DEX venues |
| VWAP | Volume-weighted benchmark price | Assessing intraday value and institutional execution context | Session anchors require adaptation for 24/7 continuous crypto markets |
| Average True Range (ATR) | Absolute price volatility | Contextualizing stop distances and planning position risk | Measures volatility scale only; provides no directional price signal |
| Fibonacci Retracement | Geometric reference levels | Locating potential pullback zones and profit targets | Levels are subjective reference points, not guaranteed support or resistance |
| Stochastic Oscillator | Range momentum position | Identifying turning points in bound, non-trending markets | Highly sensitive; produces frequent false signals during strong directional trends |
| Average Directional Index (ADX) | Trend strength magnitude | Distinguishing between trending and ranging market regimes | Quantifies trend strength only; does not indicate trend direction |
| On-Balance Volume (OBV) | Cumulative volume pressure | Confirming if volume flows align with prevailing price trends | Distorted by structural volume spikes across isolated exchange venues |
| Open Interest (OI) | Total active derivative contracts | Evaluating market leverage accumulation and structural positioning | High open interest indicates positioning scale, not directional sentiment |
| Funding Rates | Perpetual contract premium/discount | Gauge long vs. short positioning bias and market sentiment | Positive or negative funding can persist for extended periods during trends |
Cryptocurrency markets have undergone structural maturing. The growth of regulated spot exchange-traded products (ETPs), deep institutional liquidity, and decentralized perpetual futures protocols (such as Hyperliquid) has transformed market dynamics. Derivatives volume routinely exceeds spot trading activity by multiples, making technical market analysis more nuanced than ever before.
Navigating this environment requires understanding that market data reflects crowd psychology, institutional order flow, and leverage mechanics. Technical indicators serve as analytical tools to organize this data—they are probabilistic frameworks, not guaranteed prediction systems.
What Is Technical Analysis in Crypto?
Technical analysis (TA) is the study of historical market data—primarily price action, volume, and derivatives positioning—to evaluate market structure and identify potential probability setups. Rather than attempting to determine a token’s intrinsic value (the domain of fundamental analysis), technical analysis focuses on supply and demand dynamics expressed on price charts.
Core Components of Chart Analysis
-
Price Action: The raw movement of price over time, forming structural higher highs, higher lows, lower highs, or lower lows.
-
Volume: The total unit activity traded over a specified timeframe, indicating the conviction behind a price move.
-
Market Structure: The overall framework of market trends, ranges, break points, and key reaction zones.
-
Trend: The overall directional bias of the market over short, medium, or long time horizons.
-
Momentum: The velocity or rate of change in price movement over a given period.
-
Volatility: The magnitude and frequency of price fluctuations within a specific timeframe.
Primary Limitations of Technical Analysis
Technical analysis provides a structured way to manage risk and read order flow, but it operates in an environment of uncertainty:
-
False Signals: Indicators frequently generate conflicting or inaccurate signals during choppy, non-trending consolidation.
-
Changing Market Regimes: A technical strategy optimized for a high-volatility trending regime often underperforms when the market shifts to a low-volatility range.
-
Liquidity & Fragmentation: Crypto liquidity is split across global centralized spot venues, derivative platforms, and decentralized exchanges (DEXs).
-
Exogenous Shocks: Technical indicators cannot anticipate sudden macroeconomic shifts, regulatory announcements, or unexpected news events.
-
Leverage Cascades: High derivatives open interest can trigger sudden liquidation cascades, driving price price action through key technical support or resistance levels regardless of standard indicator readings.
Technical Indicators Every Crypto Trader Should Master in 2026
1. Moving Averages (SMA and EMA)
Moving averages smooth out price data to create a single trailing line, helping traders identify trend direction and potential dynamic support or resistance levels.
┌─────────────────────────────────────────────────────────────────────────┐
│ Simple Moving Average (SMA): Equal weighting to all historical periods  │
├─────────────────────────────────────────────────────────────────────────┤
│ Exponential Moving Average (EMA): Higher weighting to recent prices     │
└─────────────────────────────────────────────────────────────────────────┘
-
Calculation Overview: An SMA calculates the unweighted mean of $N$ past closes. An EMA applies a multiplier to give greater mathematical weight to the most recent data points, making it react faster to recent price action.
-
Trader Interpretation:
-
Trend Identification: A price trading above a rising 200-day SMA often suggests a broad macro uptrend, while price trading below indicates a macro downtrend.
-
Crossovers: Short-term averages crossing above long-term averages (e.g., a 50-period EMA crossing above a 200-period EMA) are interpreted as potential bullish trend signals. Conversely, short-term averages crossing below suggest bearish shifts.
-
-
When Useful: Effective in strongly trending markets to establish directional bias and highlight trailing dynamic support or resistance.
-
Major Limitations: Moving averages are lagging indicators that reflect past data. In a sideways or range-bound market, moving average crossovers produce repeated false signals (whipsaws). A crossover does not guarantee a trend reversal.
2. Relative Strength Index (RSI)
The Relative Strength Index is a bounded momentum oscillator that measures the speed and change of price movements on a scale from 0 to 100.
-
Calculation Overview: RSI compares the magnitude of recent gains to recent losses over a specified lookback period (traditionally 14 periods):
$$\text{RSI} = 100 – \left( \frac{100}{1 + \text{RS}} \right)$$where $\text{RS} = \frac{\text{Average Gain}}{\text{Average Loss}}$.
-
Trader Interpretation:
-
Overbought/Oversold: Traditionally, readings above 70 indicate overbought conditions, while readings below 30 suggest oversold conditions.
-
Divergence: Bullish divergence occurs when price makes a lower low while RSI forms a higher low, suggesting downside momentum is fading. Bearish divergence occurs when price makes a higher high while RSI forms a lower high.
-
-
When Useful: Helpful for identifying momentum exhaustion and potential turning points in range-bound markets.
-
Major Limitations: Strong directional trends can keep the RSI in overbought or oversold territory for extended periods. Assuming that an RSI above 70 is an immediate “sell” signal or below 30 is an immediate “buy” signal during a parabolic trend often leads to counter-trend missteps.
3. Moving Average Convergence Divergence (MACD)
The MACD is a trend-following momentum indicator that shows the relationship between two exponential moving averages of a token’s price.
┌─────────────────────────────────────────────────────────────────────────┐
│ MACD Line: (12-period EMA - 26-period EMA)                              │
├─────────────────────────────────────────────────────────────────────────┤
│ Signal Line: 9-period EMA of the MACD Line                              │
├─────────────────────────────────────────────────────────────────────────┤
│ Histogram: MACD Line - Signal Line                                      │
└─────────────────────────────────────────────────────────────────────────┘
-
Calculation Overview: Subtraction of the 26-period EMA from the 12-period EMA generates the main MACD line. A 9-period EMA of the MACD line acts as the “signal line.” The MACD histogram displays the visual distance between the MACD line and the signal line.
-
Trader Interpretation:
-
Signal Line Crossovers: Traders watch for the MACD line to cross above the signal line as one possible signal of bullish momentum acceleration, or below for bearish acceleration.
-
Zero-Line Crossovers: Crossing above zero confirms that short-term EMA momentum exceeds longer-term EMA momentum.
-
-
When Useful: Analyzing medium-term momentum changes and trend direction shifts.
-
Major Limitations: MACD is derived from moving averages and is lagging by design. It is generally more useful for contextualizing trend momentum than for precise trade entry timing.
4. Bollinger Bands
Developed by John Bollinger, this tool measures relative market volatility by placing envelope bands around a central moving average.
-
Calculation Overview: Bollinger Bands consist of three lines:
-
Middle Band: Typically a 20-period Simple Moving Average (SMA).
-
Upper Band: Middle Band $+ (2 \times \text{20-period Standard Deviation})$.
-
Lower Band: Middle Band $- (2 \times \text{20-period Standard Deviation})$.
-
-
Trader Interpretation:
-
Volatility Squeeze: When the bands contract tightly together (“Band Width” narrows), it signals a low-volatility period that often precedes a major volatility expansion or breakout.
-
Tagging the Bands: Traders observe how price behaves near the outer bands.
-
-
When Useful: Identifying volatility expansion/contraction cycles and setting dynamic volatility-based reference envelopes.
-
Major Limitations: Price touching or piercing the upper band is a sign of strong upward momentum, not an automatic reversal indicator. In runaway trends, price can continuously “walk the bands” upward or downward.
5. Volume (Spot, Futures, Aggregated)
Volume measures the total amount of a cryptocurrency asset traded during a given time block. In crypto technical analysis, volume provides context to price movements.
-
Calculation Overview: The sum total of base units (or USD equivalent value) exchanged within a specific candle period.
-
Trader Interpretation:
-
Breakout Confirmation: A price breakout past a key resistance level accompanied by expanding volume suggests high conviction among market participants. Breakouts on low volume carry a higher risk of being false breakouts.
-
Divergence: If price continues making new highs while volume steadily declines, it may indicate diminishing buying participation.
-
-
Venue Differences: Traders must distinguish between Spot volume (direct asset transfers), Futures volume (derivatives contracts), Exchange-specific volume (isolated to single platforms like Binance or Coinbase), and Aggregated volume (combined across major global venues).
-
When Useful: Validating market conviction, assessing venue liquidity, and evaluating the strength of chart breakouts.
-
Major Limitations: Fragmented exchange data makes obtaining a single, complete view of global crypto volume complex. Wash trading on unverified venues can also distort raw volume data.
6. Volume-Weighted Average Price (VWAP)
VWAP calculates the true average price an asset has traded at throughout a given session, weighted by both volume and price.
-
Calculation Overview:
$$\text{VWAP} = \frac{\sum (\text{Typical Price} \times \text{Volume})}{\sum \text{Volume}}$$where $\text{Typical Price} = \frac{\text{High} + \text{Low} + \text{Close}}{3}$.
-
Trader Interpretation:
-
Institutional Benchmark: Institutional participants often use VWAP as an execution benchmark to gauge whether orders are filled at favorable prices relative to market turnover.
-
Value Assessment: Price trading above VWAP suggests bullish intraday sentiment; price below VWAP suggests bearish intraday control.
-
-
When Useful: Intraday order flow evaluation, execution quality assessment, and short-term mean-reversion context.
-
Major Limitations: Traditional financial markets reset VWAP daily at market close. Because cryptocurrency markets trade 24/7/365, standard session-based VWAP requires specific adaptations (such as rolling 24-hour VWAP anchors or resetting at 00:00 UTC) to remain relevant.
7. Average True Range (ATR)
Introduced by J. Welles Wilder Jr., Average True Range is a pure volatility indicator that measures market volatility without indicating price direction.
-
Calculation Overview: ATR measures the average of “True Ranges” over a set lookback (typically 14 periods). The True Range is the greatest of:
-
Current High minus Current Low
-
Absolute value of (Current High minus Previous Close)
-
Absolute value of (Current Low minus Previous Close)
-
-
Trader Interpretation:
-
Volatility Expansion: Rising ATR indicates increasing price range variance; falling ATR indicates tightening consolidation.
-
Dynamic Risk Planning: Traders often use multiples of ATR (e.g., $1.5 \times \text{ATR}$ or $2 \times \text{ATR}$) to adjust stop-loss boundaries based on current market volatility rather than fixed percentage distances.
-
-
When Useful: Risk planning, volatility environment classification, and establishing dynamic stop-loss reference distances.
-
Major Limitations: ATR contains zero directional bias. It indicates how much price is moving, but provides no insight into whether price is moving up or down.
8. Fibonacci Retracement
Fibonacci Retracement is a charting technique that plots horizontal reference lines based on key mathematical ratios to highlight potential support and resistance areas.
-
Calculation Overview: Chartists draw a trend line between a prominent swing high and swing low. The software divides the vertical distance using standard mathematical ratios derived from the Fibonacci sequence: 23.6%, 38.2%, 50.0% (a Dow Theory median), 61.8% (the Golden Ratio), and 78.6%.
-
Trader Interpretation: During a market pullback within an established trend, traders watch these key horizontal levels for potential price stabilization or reaction.
-
When Useful: Mapping prospective support or resistance levels during market pullbacks.
-
Major Limitations: Fibonacci levels are subjective reference points that depend on which specific swing highs and lows a trader selects. They are widely monitored self-fulfilling reference zones rather than guaranteed support or resistance.
9. Stochastic Oscillator
The Stochastic Oscillator is a momentum indicator that tracks the location of a close relative to the high-low range over a set number of periods.
-
Calculation Overview: The indicator produces two lines: $\%K$ (the fast line comparing current close to range) and $\%D$ (a moving average of $\%K$). It oscillates on a scale bounded between 0 and 100.
-
Trader Interpretation: Values above 80 suggest price is trading near the top of its recent high-low range (overbought); values below 20 suggest price is near the bottom of its recent range (oversold). Crossovers of $\%K$ over $\%D$ at extreme levels are monitored for potential short-term turning points.
-
When Useful: Range-bound, non-trending consolidation markets.
-
Major Limitations: Highly sensitive to price fluctuations. In strong directional trends, the Stochastic Oscillator can generate numerous false reversal signals by staying pinned at extreme upper or lower bounds.
10. Average Directional Index (ADX)
Part of Wilder’s directional movement system, the ADX quantifies the trend strength of a market regardless of trend direction.
-
Calculation Overview: Derived from the smoothed averages of the Positive Directional Indicator ($+DI$) and Negative Directional Indicator ($-DI$). The resulting ADX scale ranges from 0 to 100.
-
Trader Interpretation:
-
Reading Trend Strength: An ADX value above 25 generally indicates a strong, trending market environment. An ADX value below 20 indicates a weak, ranging, or non-directional market environment.
-
-
When Useful: Determining whether to deploy trend-following strategies or mean-reversion strategies based on overall market regime strength.
-
Major Limitations: ADX measures trend strength only—it provides no information on trend direction by itself. An ADX reading of 45 can occur during a powerful bull market or a severe bear market.
11. On-Balance Volume (OBV)
On-Balance Volume is a cumulative momentum indicator that relates volume flow to price changes, serving as a running tally of buying and selling pressure.
-
Calculation Overview: If the current candle close is higher than the previous close, current volume is added to the running OBV total. If the current close is lower than the previous close, current volume is subtracted from the running OBV total.
-
Trader Interpretation:
-
Volume Confirmation: An upward-sloping OBV confirms an upward price trend.
-
Divergence: If price reaches a new high while OBV forms a lower high, it suggests underlying buying volume conviction is failing to support the price rise.
-
-
When Useful: Spotting accumulation or distribution trends before they fully manifest on pure price charts.
-
Major Limitations: A single anomalous high-volume trading candle caused by exchange API glitches or isolated liquidations can skew cumulative OBV calculations for extended periods.
12. Open Interest (OI)
Open Interest tracks the total number of outstanding derivative contracts (such as perpetual swaps and standard futures) that have not been settled or closed.
┌─────────────────────────────────────────────────────────────────────────┐
│ Price Up + Open Interest Up   = New capital entering / Trend conviction │
├─────────────────────────────────────────────────────────────────────────┤
│ Price Up + Open Interest Down = Short squeeze / Short position closing │
└─────────────────────────────────────────────────────────────────────────┘
-
Calculation Overview: The aggregate sum of active long and short open positions across derivative exchanges.
-
Trader Interpretation:
-
Capital Flow: Rising Open Interest alongside rising price indicates capital flowing into new long positions, confirming trend strength.
-
Leverage Warning: Unusually high Open Interest near key resistance or support levels signals heavy leverage accumulation, increasing the probability of sharp liquidation cascades.
-
-
When Useful: Measuring market leverage, evaluating trend durability, and assessing liquidation risk in crypto derivatives markets.
-
Major Limitations: Open Interest reflects overall market positioning scale, but does not state whether directional sentiment is net bullish or net bearish on its own (since every derivative contract requires both a buyer and a seller).
13. Funding Rates
Funding rates are periodic payments made between long and short traders in perpetual futures markets to keep the perpetual contract price anchored to the underlying spot index price.
-
Calculation Overview: Calculated periodically (typically every 8 hours or continuously on modern perp platforms) based on the price premium or discount of the perpetual futures contract relative to the spot index price.
-
Trader Interpretation:
-
Positive Funding Rate: Perpetual contracts trade at a premium to spot. Long positions pay shorts, indicating prevailing bullish leverage demand.
-
Negative Funding Rate: Perpetual contracts trade at a discount to spot. Short positions pay longs, indicating prevailing bearish leverage demand.
-
Extreme Sentiment: Abnormally high funding rates indicate crowded leverage trades, which often precede sharp counter-trend liquidations (squeeze events).
-
-
When Useful: Assessing derivatives leverage positioning bias and evaluating market sentiment extremes.
-
Major Limitations: Funding rates can remain strongly positive or negative for extended periods during powerful bull or bear trends; an elevated funding rate does not guarantee an immediate price reversal.
14. Support and Resistance
Support and resistance levels are identified horizontal price zones where supply and demand balance has historically paused or reversed price movements.
-
Identification Overview: Chartists mark price levels where market price has repeatedly turned back—forming horizontal support (floors where demand absorbs selling pressure) or horizontal resistance (ceilings where supply absorbs buying pressure).
-
Trader Interpretation:
-
Breakouts & Retests: When price convincingly breaks through a resistance zone with strong volume, that level often acts as potential new support on subsequent retests.
-
-
When Useful: Providing a structural baseline to contextualize indicator signals and map market structure.
-
Major Limitations: Support and resistance zones are broad price ranges rather than precise lines. In crypto markets, price frequently brief “wicks” through established levels to collect liquidity before reversing.
15. Market Structure (Trend Architecture)
Market structure maps the overall structural progression of price action by categorizing sequences of price peaks and troughs.
Bullish Market Structure:  Higher Highs (HH)  +  Higher Lows (HL)
Bearish Market Structure:  Lower Lows (LL)   +  Lower Highs (LH)
-
Identification Overview: Evaluates whether price is making consecutive Higher Highs (HH) and Higher Lows (HL) in an uptrend, or Lower Lows (LL) and Lower Highs (LH) in a downtrend. A “Break of Structure” (BOS) occurs when price breaks past the prior key swing low or high.
-
Trader Interpretation: Traders use market structure to define the overall directional trend bias before consulting secondary technical indicators.
-
When Useful: Establishing trend context and identifying structural shifts in overall market direction.
-
Major Limitations: Market structure analysis involves subjective selection of key swing points across different timeframes. Higher-timeframe structures can conflict directly with lower-timeframe structures.
Crypto-Specific Indicators and Onchain Metrics
Indicators That Matter More in Crypto Than Traditional Markets
Cryptocurrency market structure differs fundamentally from traditional asset markets due to continuous 24/7/365 trading, native digital asset rails, public blockchain ledgers, and a heavy reliance on perpetual futures derivatives.
-
Derivatives Leverage Dynamics: Metrics like aggregate Open Interest and Funding Rates carry significantly more influence in short-term crypto price discovery than in traditional equity markets because crypto perpetual futures volume regularly trades at multiple times spot volume.
-
Liquidation Data: Public tracking of estimated liquidation clusters highlights zones where cascading stop orders are concentrated.
-
Stablecoin Supply & Flows: Tracking the growth or shrinkage of major stablecoin supplies (e.g., USDT, USDC) provides insights into global liquidity available for digital asset allocation.
-
Exchange Inflows/Outflows: Monitoring large transfers of assets into or out of known exchange wallet addresses offers visibility into structural supply shifts.
Are Onchain Metrics Technical Indicators?
It is essential to distinguish between Technical Analysis (TA) and Onchain Analytics:
┌─────────────────────────────────────────────────────────────────────────┐
│ Technical Indicators                                                    │
│ Primary Focus: Price, volume, and order flow metrics derived directly   │
│                from market trading venues.                              │
├─────────────────────────────────────────────────────────────────────────┤
│ Onchain Metrics                                                         │
│ Primary Focus: Fundamental network usage data extracted directly from   │
│                public blockchain ledgers.                               │
└─────────────────────────────────────────────────────────────────────────┘
-
Onchain Analytics Examples:
-
Active Addresses: Measures unique daily transacting network participants.
-
MVRV Ratio (Market Value to Realized Value): Compares total market capitalization against realized capitalization (the value of tokens based on their last onchain movement price).
-
Exchange Reserves: Tracks the total balance of specific tokens held in exchange custody wallets.
-
-
Relationship to Charting: Onchain metrics provide structural fundamental and valuation context regarding network adoption and supply distribution. They complement technical chart analysis, but do not replace price-action indicators for timing short-term market entries or risk management boundaries.
How to Combine Indicators Without Overcomplicating Your Chart
Adding too many tools to a price chart leads to “analysis paralysis”—a state where conflicting indicator signals prevent disciplined execution. The goal of combining indicators is to gather non-redundant insights across distinct market dimensions: Trend, Momentum, Volatility, Volume, and Positioning.
Recommended Indicator Combinations
1. Trend Setup
-
Tools: 200-period EMA + Market Structure + Volume
-
Analytical Purpose: Determines overall market directional bias, checks structural swing points, and confirms whether high volume supports the trend.
2. Momentum Setup
-
Tools: RSI + MACD + Volume
-
Analytical Purpose: Evaluates the velocity of price movement, monitors momentum histogram divergence, and checks volume conviction.
3. Volatility Setup
-
Tools: Bollinger Bands + ATR + Aggregated Volume
-
Analytical Purpose: Identifies low-volatility compression periods, measures absolute average true range for risk sizing, and watches for volume expansion during breakouts.
4. Derivatives Setup
-
Tools: Open Interest + Funding Rate + Price Structure
-
Analytical Purpose: Evaluates whether leverage is entering or exiting the market, gauges sentiment bias, and identifies key price levels where liquidation cascades could occur.
5. Breakout Setup
-
Tools: Horizontal Support/Resistance + Volume + ATR
-
Analytical Purpose: Highlights key reaction zones, verifies volume expansion on price breaks, and uses ATR to define volatility-adjusted risk bounds.
Why Five Momentum Indicators Are Usually Too Many
Using multiple indicators that measure the exact same dimension of market data creates technical redundancy without providing new information.
┌─────────────────────────────────────────────────────────────────────────┐
│ REDUNDANT SETUP (High Overlap)                                         │
│ RSI + Stochastic + MACD + Williams %R + CCI                             │
│ Result: Five tools telling you the exact same thing about momentum.      │
├─────────────────────────────────────────────────────────────────────────┤
│ EFFICIENT SETUP (Multi-Dimensional)                                     │
│ Market Structure (Trend) + RSI (Momentum) + ATR (Volatility) + Volume   │
│ Result: Four distinct perspectives covering distinct market dynamics.   │
└─────────────────────────────────────────────────────────────────────────┘
A “Simple Chart” Approach for Beginners
A balanced chart layout contains no more than 3 to 4 distinct tools covering key structural dimensions:
-
Price Action & Structure: Clear candles with marked key horizontal support/resistance.
-
One Trend Indicator: e.g., 50-period or 200-period EMA to establish directional bias.
-
One Momentum OR Volatility Indicator: e.g., RSI for momentum divergence OR ATR for volatility-based risk context.
-
One Volume/Positioning Indicator: e.g., Volume histogram or derivatives Open Interest.
Which Indicators Work Best in Different Market Conditions?
No single technical indicator operates effectively across all market environments. Matching tools to current market conditions is essential for clear analysis.
                       ┌─────────────────────────────┐
                       │  Classify Market Regime     │
                       └──────────────┬──────────────┘
                                      │
       ┌──────────────────────────────┼──────────────────────────────┐
       ▼                              ▼                              ▼
┌──────────────┐              ┌──────────────┐              ┌──────────────┐
│  Trending    │              │ Range-Bound  │              │ Volatile/    │
│  Market      │              │ Market       │              │ Breakout     │
└──────┬───────┘              └──────┬───────┘              └──────┬───────┘
       │                             │                             │
       ▼                             ▼                             ▼
• Moving Averages              • RSI                         • Volume
• ADX (> 25)                   • Stochastic                  • ATR
• MACD                         • Support/Resistance          • Bollinger Bands
• Volume                       • Bollinger Bands             • Open Interest
-
Trending Environment: Moving averages, ADX, and MACD help track direction and momentum, while volume confirms trend conviction.
-
Range-Bound Environment: Bounded oscillators like RSI and Stochastic identify momentum extremes near horizontal support and resistance boundaries.
-
High-Volatility / Breakout Environment: ATR quantifies expanding price variance, Bollinger Band squeezes signal potential volatility expansion, and Open Interest/Volume highlight breakout participation.
Why Technical Indicators Can Fail
Technical indicators calculate mathematical outputs based on historical inputs. They possess no predictive magic and frequently generate inaccurate signals due to inherent market structural factors:
-
Lagging Mathematical Nature: Indicators like moving averages are smooth historical averages. By the time a crossover occurs, a substantial portion of the price move has already taken place.
-
Whipsaws and False Breakouts: In low-volatility or non-trending markets, price frequently breaks slightly past key technical levels—triggering technical entry signals—only to abruptly reverse direction.
-
Liquidity Fragmentation: Crypto trading takes place across diverse venues. An indicator calculated solely on single-exchange spot data may miss opposite liquidity dynamics occurring on major perpetual futures platforms or decentralized exchanges.
-
Market Manipulation & Stop Runs: Thin order books allow large traders (“whales”) to execute temporary price spikes designed to trigger retail stop-loss orders around obvious indicator levels.
-
Macro Economic & News Shock Events: Unexpected interest rate decisions, regulatory announcements, or unexpected macroeconomic updates override technical chart setups immediately.
-
Overfitting: Customizing indicator parameters to perfectly match historical chart patterns often fails in live forward trading because past price patterns rarely repeat identically.
Technical Analysis Mistakes Crypto Traders Should Avoid
-
Treating Indicators as Automatic Buy/Sell Signals: Expecting an overbought RSI or a moving average crossover to act as an infallible trade trigger ignores underlying market context.
-
Using Redundant Indicator Configurations: Loading a chart with multiple momentum tools that simply mirror one another.
-
Ignoring Volume and Derivatives Positioning: Relying solely on price line patterns while ignoring real-time volume, open interest, and funding rate dynamics.
-
Trading Counter to Primary Market Structure: Attempting to force counter-trend trades based on minor lower-timeframe signals while fighting a major higher-timeframe trend.
-
Ignoring Key Macro & News Developments: Assuming technical patterns operate in isolation from broader financial market conditions, interest rate environments, and regulatory updates.
-
Over-Optimizing (Curve-Fitting) Historical Parameters: Adjusting settings to fit past data so tightly that the strategy loses robustness in live trading.
-
Abandoning Risk Limits After a Losing Trade: Treating technical analysis as a guarantee rather than a probability framework, leading to revenge trading or expanding risk limits during losses.
A Practical Technical-Analysis Workflow
A structured step-by-step process helps traders evaluate chart setups objectively and avoid emotional decision-making:
Step 1: Identify Higher-Timeframe Market Structure (Daily/4-Hour swing highs and lows)
   │
Step 2: Determine Overall Market Regime (Trending, Range-Bound, or High-Volatility Consolidation)
   │
Step 3: Map Key Horizontal Support and Resistance Levels
   │
Step 4: Analyze Volume and Liquidity Dynamics (Check spot vs. futures conviction)
   │
Step 5: Examine Momentum Indicators (Watch for RSI/MACD alignment or structural divergence)
   │
Step 6: Review Derivatives & Leverage Metrics (Check Open Interest trends and Funding Rates)
   │
Step 7: Factor in Macro Economic Context & High-Impact Scheduled News Events
   │
Step 8: Define Dynamic Risk Parameters (Calculate ATR-based position sizing and invalidation levels)
   │
Step 9: Conduct an Objective Post-Trade Review (Document trade performance independently of outcome)
Should You Backtest Technical Indicators?
Backtesting involves applying a defined technical indicator strategy to historical market data to evaluate how it would have performed over past market cycles.
Benefits of Historical Testing
Proper historical testing helps traders evaluate rule clarity, calculate potential maximum drawdown profiles, and understand how a strategy behaves across different market regimes.
Common Backtesting Pitfalls
-
Survivorship Bias: Testing strategies exclusively on assets currently in the top 100 market capitalization, ignoring assets that failed or lost liquidity during past cycles.
-
Look-Ahead Bias: Accidental inclusion of future price data into historical entry calculations that would not have been available in real-time execution.
-
Slippage and Transaction Costs: Failing to account for exchange trading fees, funding rate costs, and order execution slippage, which severely impact real-world profitability.
-
Overfitting (Curve-Fitting): Tweak-optimizing indicator settings until historical backtests show unrealistic equity curves. Historical test performance does not guarantee future results in live forward markets.
What Crypto Traders Should Watch in 2026
Cryptocurrency market microstructure continues to evolve across several structural fronts:
-
Maturation of Institutional ETPs: Spot Bitcoin and Ethereum exchange-traded products have shifted crypto market access into traditional brokerage infrastructure. Institutional allocations compress realized volatility over longer time horizons while introducing larger daily liquidity flows.
-
Expansion of Regulated & Decentralized Derivatives: The rise of continuous perpetual futures products on traditional exchanges (e.g., CME, Cboe) alongside high-performance decentralized perpetual exchanges (e.g., Hyperliquid) has distributed market leverage across both onchain and offchain venues.
-
Stablecoin Integration & Global Liquidity: Institutional stablecoin frameworks function as core financial settlement infrastructure, making global stablecoin supply changes a central indicator for broader digital asset liquidity.
-
Regulatory Clarity & Market Structure Rules: Bipartisan digital asset frameworks in major jurisdictions clarify market guidelines, shifting institutional emphasis from speculative trading toward portfolio allocation and execution quality.
Technical Indicators Cannot Replace Risk Management
Technical indicators provide context for market probability, but they do not eliminate market risk. Sustained trading discipline depends on structured risk controls:
-
Position Sizing: Calculating trade size based on a fixed percentage of total portfolio capital at risk (e.g., risking no more than 1% to 2% of equity per trade setup) rather than arbitrarily selecting contract sizes.
-
Pre-Defined Invalidation Points: Establishing exact price levels where a technical setup is proven wrong before entering a trade, utilizing stop-loss boundaries based on structure or ATR.
-
Managing Leverage Exposure: Utilizing leverage strictly as a capital efficiency tool rather than a speculative amplifier. Excessive leverage increases liquidation risk regardless of how strong a technical indicator signal appears.
-
Accounting for Market Liquidity: Ensuring position sizes remain appropriate relative to order book depth to avoid execution slippage during high-volatility events.
FAQ
What are the best technical indicators for crypto trading?
There is no single “best” technical indicator. Most experienced traders combine non-redundant tools—such as a moving average for trend direction, RSI for momentum, volume for conviction, and open interest for leverage context—to analyze different dimensions of the market.
Which indicator is best for beginners?
Beginners often start with simple, structural tools: a 50-period or 200-period Exponential Moving Average (EMA) to identify overall trend bias, basic volume bars to confirm activity, and horizontal support and resistance lines to map key price levels.
Is RSI reliable for cryptocurrency?
RSI is useful for identifying momentum shifts and structural divergences, but it can remain in overbought (>70) or oversold (<30) territory for extended periods during strong trends. It is most effective when combined with trend and market structure analysis rather than used as an isolated buy/sell trigger.
What does MACD tell crypto traders?
MACD shows the relationship between two moving averages of price, helping traders identify changes in momentum direction, trend acceleration, and signal line crossovers. It is generally a lagging tool best used for confirming trend context rather than pinpointing exact entry prices.
Are moving averages useful for Bitcoin?
Yes. Long-term moving averages (such as the 50-day and 200-day SMAs) are widely observed by both retail and institutional market participants to track broader market trends and identify long-term dynamic support or resistance zones.
What is the best indicator for crypto volatility?
Average True Range (ATR) and Bollinger Bands are widely used to analyze volatility. ATR measures absolute price range variance to assist with stop-loss planning, while Bollinger Bands highlight periods of volatility compression (squeezes) and expansion.
How important are funding rates and open interest?
In cryptocurrency markets, where perpetual futures volume routinely exceeds spot volume, funding rates and open interest are critical metrics. They allow traders to gauge leverage accumulation, evaluate long/short market sentiment bias, and identify potential liquidation risks.
How many indicators should a trader use?
Most disciplined traders keep their charts uncluttered by using no more than 3 to 4 distinct, non-redundant indicators covering trend, momentum, volume, and positioning to avoid analysis paralysis.
Technical indicators are analytical tools designed to help traders interpret historical price action, measure market momentum, quantify volatility, and track volume and leverage dynamics. As digital asset markets mature with deeper institutional participation, expanded derivatives infrastructure, and refined regulatory frameworks, technical analysis remains a foundational skill for contextualizing market movement. However, no indicator or combination of tools can predict market outcomes with certainty. Successful market participation requires combining technical analysis with strict risk management, emotional discipline, and a thorough understanding of underlying market structure.